It is important to be able to carry out calculations related to cost-benefit of planned energy efficiency measures. Such calculations should include potential changes in fuel consumption, emissions (CO2 and NOx) and costs associated with the implementation of energy efficiency measures. The estimated cost savings and CO2 reductions should then be included in a profitability analysis of the measure, where also measure cost is calculated.
The Norwegian oil and gas industry has developed a tool that can be used to, for example:
- Establish and choose good business case with corresponding calculations for use in decision making.
- To show the CO2 reduction after implementation of energy efficiency measures.
- Reporting of CO2 reduction.
- To show NOx reduction after implementation of energy efficiency measures.
- Assess funding support from Enova or NOx Fund.
The industry tool is available for members of Norwegian Oil and Gas, and can be downloaded from their member pages.
How to calculate the effect of a measure is described in the box below.
| Calculating the effects of measures |
|---|
|
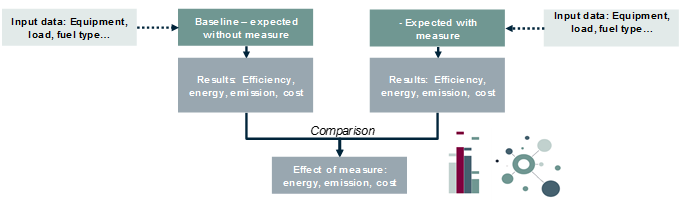
The proposed methodology compares the expected energy, emissions and costs after an initiative is implemented, with values from the baseline (without energy efficiency measure). This is illustrated below for power generation.
|
Input data and assumptions
Various types of input data and assumptions are used in the tool that has been developed by the Norwegian oil and gas industry. The input data and assumptions are based on several sources and are, for example, average values or recommended values for use in energy efficiency calculations. However, it is still recommended to use field-specific values if this is possible, as this will give a better result for your own calculations for an installation.
Main sources of emission factors that are used as default values are:
- Norwegian Environment Agency - National standard factors
- Norwegian Oil and Gas, 044 Recommended guidelines for emissions reporting
- Average of field specific emission reports (from Norwegian Oil and Gas’ website)
- NPDs list of engines and turbines
Calculations and rules of thumb
It can often be useful to make rough estimates or have access to various rules of thumb when discussing energy, emissions and costs related to energy efficiency measures.
In the calculation tool below it is possible to make rough estimates of CO2 emissions from fuel gas and diesel, cost of CO2 emissions, fuel gas and diesel, and maintenance costs for gas turbines. The lowest input value that can be used in the calculations is 1.0. The answers are normally given to one decimal place, but it is important to remember that these are rough estimates.
Some selected rules of thumb are also presented further below. These are approximate guide values that are useful when discussing energy, emissions and costs. Both the rules of thumb and the calculation tool are based on the standard assumptions that have been applied in the Norwegian Oil and Gas industry tool.
| CO2 emissions from fuel gas | ||
| Sm3 fuel gas | = | tonne CO2 |
| (Simple calculation from a fuel gas volume to CO2 emissions) | ||
| CO2 emissions from diesel | ||
| tonne diesel | = | tonne CO2 |
| (Simple calculation from a diesel amount to CO2 emissions) | ||
| CO2 emissions costs | ||
| tonne CO2 | = | NOK CO2 |
| (Simple calculation for the cost of CO2 emissions) | ||
| Fuel gas costs | ||
| Sm3 fuel gas | = | NOK fuel gas |
| (Simple calculation for the cost of fuel gas) | ||
| Diesel costs | ||
| tonne diesel | = | NOK diesel |
| (Simple calculation for the cost of diesel) | ||
| Maintenance costs for gas turbines | ||
| running hour for a gas turbine | = | NOK in maintenance costs |
| (This allows calculating maintenance costs from running a gas turbine) | ||
| Rules of thumb for energy, emissions, costs and volumes | ||||||||||||||||||||||||||||||||||||||||||||||||||||||||||||||||||||||||||||||||||||||||||||||||||||||
|---|---|---|---|---|---|---|---|---|---|---|---|---|---|---|---|---|---|---|---|---|---|---|---|---|---|---|---|---|---|---|---|---|---|---|---|---|---|---|---|---|---|---|---|---|---|---|---|---|---|---|---|---|---|---|---|---|---|---|---|---|---|---|---|---|---|---|---|---|---|---|---|---|---|---|---|---|---|---|---|---|---|---|---|---|---|---|---|---|---|---|---|---|---|---|---|---|---|---|---|---|---|---|
|
||||||||||||||||||||||||||||||||||||||||||||||||||||||||||||||||||||||||||||||||||||||||||||||||||||||
![]() Energy management in practice
Energy management in practice
| Gas import on Gyda |
|---|
|
Gyda gas import is another good example of the environmental measures they are currently implementing or have implemented on Gyda. Due to declining production, Gyda has come to the point where they are no longer self-sufficient with fuel gas for their gas turbines. To maintain normal operations and carry out necessary plugging operations in connection with the cease of operations, Repsol has signed an agreement with the Ekofisk license for a reverse gas export line from Gyda to Ekofisk so they can import gas. The agreement ensures a good supply of fuel, with significantly lower CO2 and NOx emissions, and less need for maintenance of the turbines in the final period. Without gas import, it would have been necessary to use diesel supplied by a bunkering vessel for power generation from 2017. In the first full year of gas import (2018) avoided NOx emissions will be close to 78 000 kg and avoided CO2 emissions will be more than 10 000 tonnes. That does not include emissions from the weekly bunkering vessel. |